Peak Health home > Landscapes > Climate Vulnerability
Summary
The climate vulnerability of Mt. Tam’s plant communities provide another way to look at the overall health of the mountain. For the 2022 Peak Health assessment, Pepperwood Preserve scientists used three models to study how climate change may affect them. These tools can help us understand possible climate impacts and guide what to monitor. All three models rely on the U.S. Geological Survey’s Basin Characterization Model (BCM), which shows monthly water balance based on weather, land features, and geology. A key measure from BCM is the Climatic Water Deficit (CWD), the amount of water plants need but don’t get. CWD helps predict where plants may struggle with drought and how species might shift in the future. Because BCM accounts for local conditions like slope and soil depth, CWD can highlight areas most at risk—such as dry, south-facing slopes with thin soils. This information helps managers spot vulnerable areas and decide where extra care is needed, like improving soil moisture, restoring hydrology, or monitoring for plant loss. More about these three approaches can be found below.
Although the methods for the three approaches described previously vary, there was enough agreement to confidently establish a climate vulnerability framework for vegetation communities. Below is a summary of how the region's vegetation may respond to climate change:
- Most vulnerable: Redwood forests and other vegetation in cooler, wetter niches (e.g., coastal scrub, black oak, canyon live oak, tanoak), many of which may shrink or disappear.
- May expand: Vegetation adapted to hotter, drier conditions, shifting toward coastal and lower elevation areas.
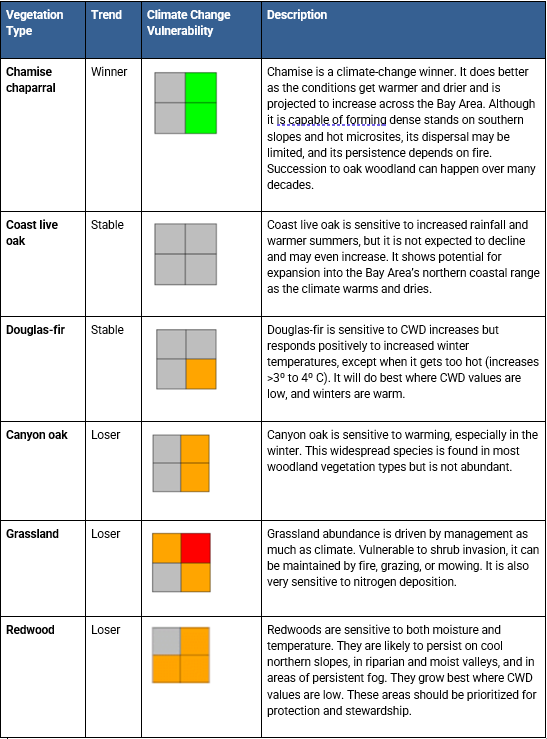
- Some mixed findings underscore the need for on-the-ground monitoring. For example, chamise chaparral may expand in one model (Ackerly 2015) but is ranked moderately vulnerable in another (Thorne 2016). Douglas-fir stability is also debated—stable in one model (Ackerly 2015), moderately vulnerable in another (Thorne 2016). Grassland vulnerability is uncertain as it is highly dependent on future rainfall, with potential declines under hotter/wetter futures. Stewardship and preventing conversion to other vegetation types could play a key role in maintaining them.
These types of models do not predict when or exactly how the changes will occur. Mechanisms of change may be episodic, punctuated by extreme events such as drought and fire. Potential adaptation will depend upon each species’ capacity for dispersal and migration, as well as any barriers to these processes. Field-based and remote sensing observations are essential to track shifts, detect tipping points, and understand reorganization of communities. Monitoring should also assess native vs. invasive species dynamics.
Three Approaches
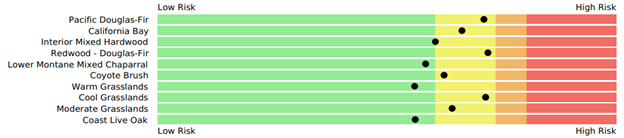
1) The Bay Area Conservation Lands Network (2019) created tools that show plant “comfort zones” based on how much drought they can tolerate. By looking at the limits of drought tolerance for different plant communities, scientists can see which ones are close to their breaking point and most at risk as conditions get drier. Based on current conditions alone, including iconic redwoods and Douglas-fir, 10 plant communities in the One Tam area of focus were identified as vulnerable (below).
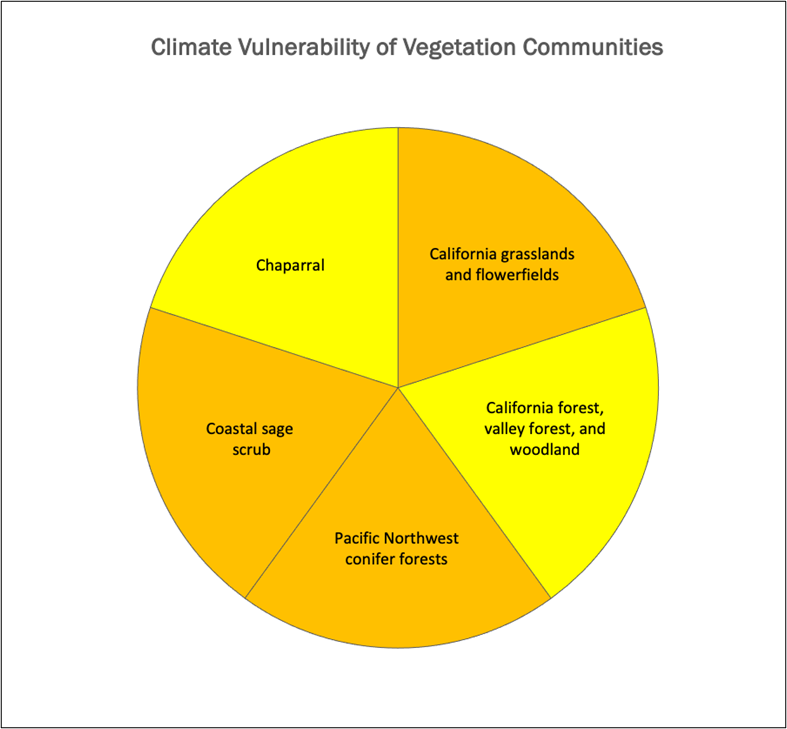
2) The California Department of Fish and Wildlife and UC Davis studied how climate change could affect 31 types of vegetation across the state (Thorne et al., 2016). They looked at how sensitive plants are and how well they can adapt, based on expert assessment of their life history traits. Each plant type was given a climate vulnerability ranking: moderate, mid-to-high, or high. Most of Mt. Tam’s plant communities fit into these categories, except for serpentine barrens, which were not included in the study.
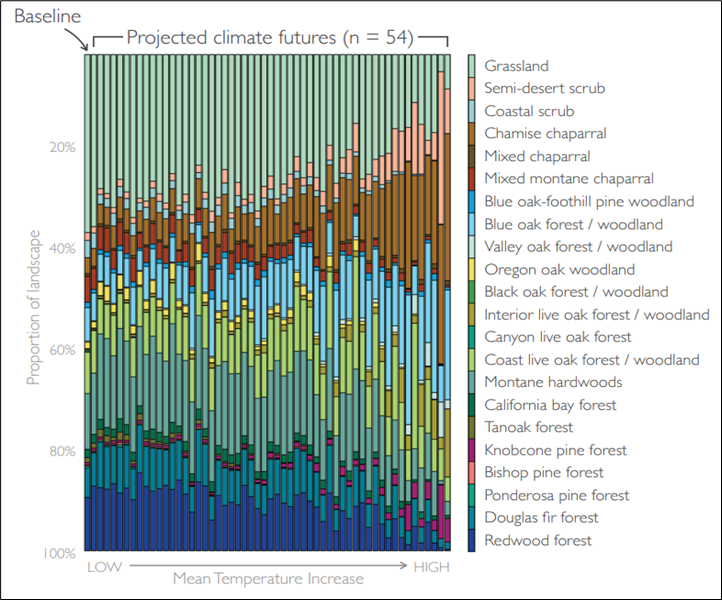
3) In the Climate Ready North Bay: Vegetation Reports (Ackerly et al. 2015), scientists modeled how plant ranges might change with future climate. Unlike the other two approaches, this method shows not only which vegetation types may decline, but also which ones could expand. It doesn't aim to predict novel vegetation communities that may occur. Based on 54 different future climate scenarios applied to 22 major vegetation types, they projected future relative spatial extents of 16 vegetation types for the Marin Coast Range landscape unit (below).
The table below lists climate “winners and losers” using a four-square visual representation of variability based on higher or lower rainfall scenarios.
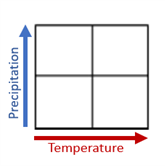
The finding indicated in the Trend column is based on the vegetation type’s projected extent compared to its current status: climate “winners” increase 125%, stable communities occupy 75% to 125%, and “losers” occupy less than 75% (Ackerly et. al 2015).
Climate-vulnerable Iconic Species
While in the 2022 assessment we only looked at plant communities at a landscape-scale, based on predictions of our future climate we can also describe individual species as climate-vulnerable. Below are several iconic species included in this assessment that are climate-vulnerable. We have also described potential impacts of climate change to each indicator species and community throughout these Peak Health pages and in the 2022 report.
Coho salmon (Oncorhynchus kisutch) are good indicators of the effects of climate change on a variety of habitats as they require freshwater and open ocean habitats in order to thrive. Coho salmon will not fare well under the current climate projections of shorter, more intense periods of rainfall and extended droughts. Rising temperatures will likely cause greater evaporation of streams and floodplain habitats, and intense rainfall can cause erosion and harmful sediment deposition. However, the many habitat restoration projects both completed and in progress in the watersheds of the One Tam area of focus may help counteract some of these impacts.
California red-legged frogs (Rana draytonii) are good climate change indicators as they require a variety of aquatic and terrestrial habitats for different parts of their lifecycle. Under hotter, drier current climate projections, survival of egg masses and tadpoles are likely to decrease. Increased frequency and elevation of high tides from sea level rise or more intense storms could also raise salinity levels in low-lying breeding habitat.
Coast redwoods (Sequoia sempervirens) are temperature- and precipitation-sensitive, but how predicted climate changes will impact redwood forest health is complex. Redwoods have shown increased growth with climate changes so far, but increasing soil aridity and the loss of fog could be serious threats. In general, models project that this species will decline in extent across the north coast.
Marin manzanita (Arctostaphylos virgata) is a particularly good indicator of changes in summertime fog. There has been a declining trend in the number of foggy days along the California coast and future hotter climates could further reduce fog frequency.
resources
Ackerly, D. D., Cornwell, W. K, Weiss, S. B., Flint, L. E., & Flint, A. L. (2015). A geographic mosaic of climate change impacts on terrestrial vegetation: Which areas are most at risk? PLoS ONE, 10(6), e0130629. http://dx.doi.org/10.1371/journal.pone.0130629
Ackerly, D. D., Ryals, R. A., Cornwell, W. K, Loarie, S. R., Veloz, S., Higgason, K. D, Silver, W. L., & Dawson, T. E. (2012). Potential impacts of climate change on biodiversity and ecosystem services in the San Francisco Bay Area (Publication number CEC-500-2012-037). California Energy Commission. https://cawaterlibrary.net/wp-content/uploads/2017/06/CEC-500-2012-037.pdf
Aerial Information Systems [AIS]. (2015). Summary report for the 2014 photo interpretation and floristic reclassification of Mt. Tamalpais Watershed forest and woodlands project. Prepared for Marin Municipal Water District. https://tukmangeospatial.egnyte.com/dl/3UV0A0o3HS
Bay Area Open Space Council [BAOSC]. (2019). The conservation lands network 2.0 [Report]. https://www.bayarealands.org/maps-data
Cornwell, W. K., Stuart, S. A., Ramirez, A., Dolanc, C. R., Thorne, J. H., & Ackerly, D. D. (2012). Climate change impacts on California vegetation: Physiology, life history, and ecosystem change (Publication number CEC-500-2012-023). California Energy Commission. https://escholarship.org/uc/item/6d21h3q8
Flint, L. E., Flint, A. L., Thorne, J. H., & Boynton, R. (2013). Fine-scale hydrologic modeling for regional landscape applications: The California Basin characterization model development and performance. Ecological Processes, 2(25). http://www.ecologicalprocesses.com/content/2/1/25
Freed, S., & McAllister, K. (2008). Occurrence and distribution of mammals on the McChord Air Force Base, Washington. Environmental Practice, 10(3), 116–124. https://doi.org/10.1017/S146604660808023X
Golden Gate National Parks Conservancy [GGNPC], Tukman Geospatial, & Aerial Information Systems. (2021). 2018 Marin County fine scale vegetation map datasheet. Tamalpais Lands Collaborative (One Tam). https://tukmangeospatial.egnyte.com/dl/uQhGjac1zw
Hobbs, R. J., & Mooney, H. A. (2005). Invasive species in a changing world: Global change and invasives. In H. A. Mooney, R. N. Mack, J. A. McNeely, L. E. Neville, P. J. Schei, & J. K. Waage (Eds.), Invasive alien species: A new synthesis (pp. 310–331). Island Press.
Jacobsen, A. L., Pratt, R. B., Ewers, F. W., & Davis, S. D. (2007). Cavitation resistance among 26 chaparral species of southern California. Ecological Monographs, 77(1), 99–115. https://www.jstor.org/stable/27646074
Mack, M. C., & D’Antonio, C. M. (1998). Impacts of biological invasions on disturbance regimes. Trends in Ecology and Evolution, 13(5), 195–198. https://doi.org/10.1016/S0169-5347(97)01286-X
McPherson, B. A., Mori, S. R., Wood, D. L., Kelly, M., Storer, A. J., Svihra, P., & Standiford, R. B. (2010). Responses of oaks and tanoaks to the sudden oak death pathogen after 8 years of monitoring in two coastal California forests. Forest Ecology and Management, 259(12), 2248–2255. https://doi.org/10.1016/j.foreco.2010.02.020
Paddock, W. A. S. III, Davis, S. D., Pratt, R. B., Jacobsen, A. L., Tobin, M. F., López-Portillo, J., & Ewers, F. W. (2013). Factors determining mortality of adult chaparral shrubs in an extreme drought year in California. Aliso: A Journal of Systematic and Evolutionary Botany, 31(1), 49–57. https://scholarship.claremont.edu/aliso/vol31/iss1/8
Pimentel, D. (2005). Environmental consequences and economic costs of alien species. In Inderjit (Ed.), Invasive plants: Ecological and agricultural aspects (pp. 269–276). Birkhauser Verlag. https://doi.org/10.1007/3-7643-7380-6_17
Swiecki, T. J., & Bernhardt, E. A. (2013). Long-term trends in coast live oak and tanoak stands affected by Phytophthora ramorum canker (sudden oak death): 2000–2010 disease progress update. Phytosphere Research. http://www.phytosphere.com/publications/Phytophthora_case-control2000-2010.htm
Thorne, J. H., Boynton, R. M., Holguin, A. J., Stewart, J. A. E., & Bjorkman, J. (2016). A climate change vulnerability assessment of California’s terrestrial vegetation. California Department of Fish and Wildlife. https://nrm.dfg.ca.gov/FileHandler.ashx?DocumentID=116208&inline
Thorne, J. H., Choe, H., Boynton, R. M., Bjorkman, J., Albright, W., Nydick, K., Flint, A. L., Flint, L. E., & Schwartz, M. W. (2017). The impact of climate change uncertainty on California’s vegetation and adaptation management. Ecosphere, 8(12), e02021. https://doi.org/10.1002/ecs2.2021