Peak Health home > Landscapes
Peak Health describes how certain species, taxonomic groups, or vegetation communities can be used to measure Mt. Tam’s health. Tracking these important indicators is one way to understand and evaluate how the mountain’s natural resources are functioning. However, these individual indicators represent only a portion of the ecological communities and natural processes they're a part of.
Combining—or “rolling up”— indicators in different ways allows us to develop a more complete understanding of how well ecological systems and landscape-level processes are functioning within the One Tam area of focus. Although not an exact science, this approach gives land managers new ways to understand what is happening and make decisions based on that broader understanding.
Because the interplay among human use, health indicators, and ecosystem processes and stressors is complicated and important details may be obscured, it is important to interpret the results of these roll-ups carefully. For example, combining individual species and community-level indicators may result in an ecosystem being described as doing well overall despite some species within it doing poorly. Given the range of possible contributing factors in any given ecosystem, it can also be challenging to decide what to include and what to leave out.
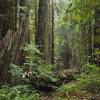
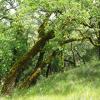
The 2016 Peak Health assessment considered a number of ways that indicators could be combined to communicate broader ecosystem health in a meaningful way. At the time, we only had enough information to pursue the question of the mountain’s overall health and that of select ecological communities (e.g., oak woodlands, grasslands, shrublands, and redwoods). Using what we knew from existing models, we also looked at climate-vulnerable species and communities. All of those analyses were updated in 2023, and include a look at how these indicators and ecosystems might fare under recent regional climate models by Pepperwood Preserve climate scientists.
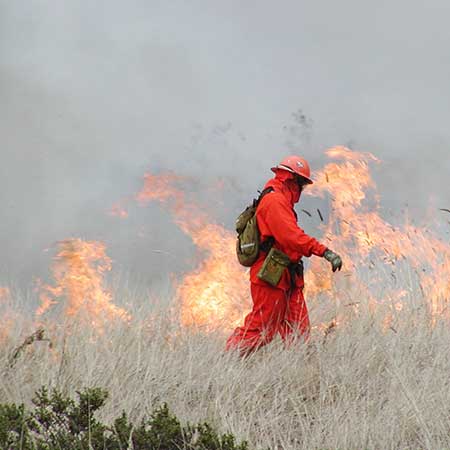
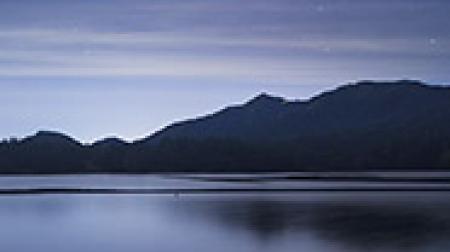
 MMWD Photo
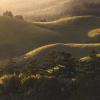
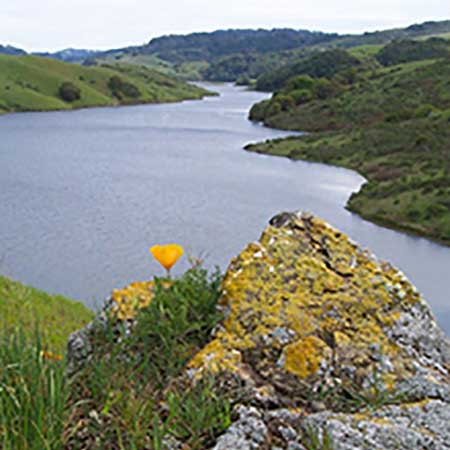
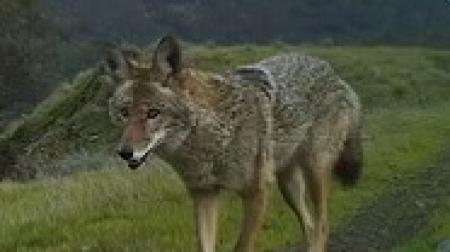
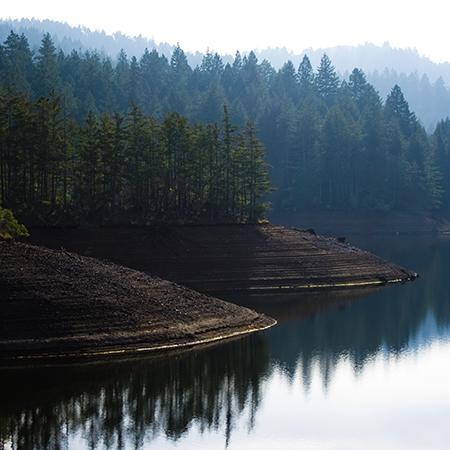 Photo by Tung Chee/Parks Conservancy
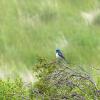
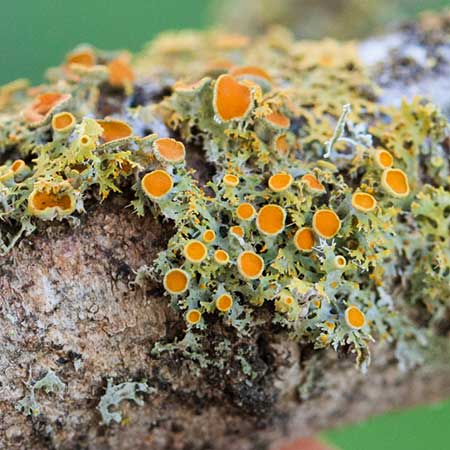