Ecosystems
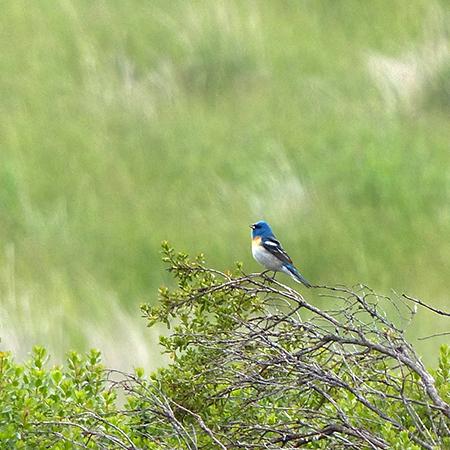
 MMWD Photo
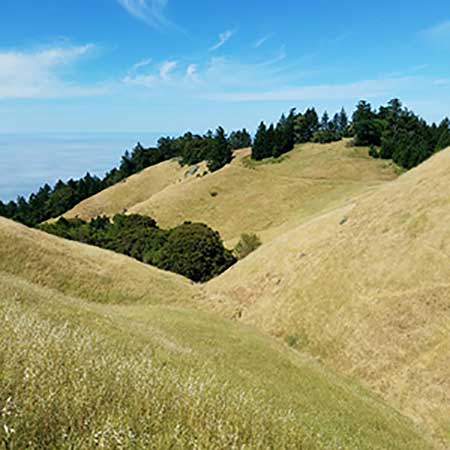
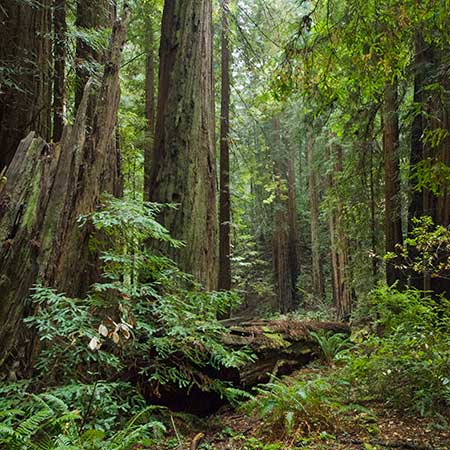 Coast Redwood Communities | Photo by Jessica Weinberg/NPS
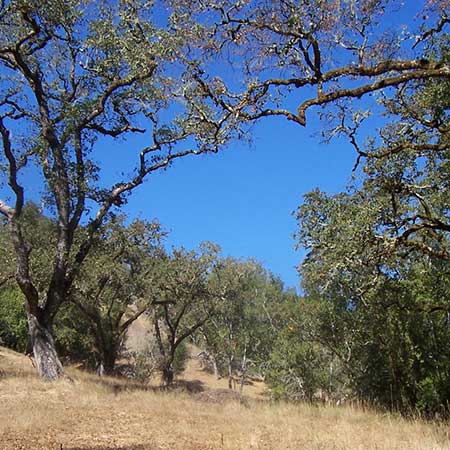
MMWD Photo
Coast Redwood Communities | Photo by Jessica Weinberg/NPS
Coast Redwood Communities | Photo by Jessica Weinberg/NPS
MMWD Photo
Coast Redwood Communities | Photo by Jessica Weinberg/NPS
Peak Health home > Landscapes > Ecosystems
Each ecological community or ecosystem roll-up was created by aggregating all pertinent vegetation and wildlife metrics from individual indicators. Each metric has its own condition, trend, and confidence level (as determined in the individual indicator assessment). Explore each at the links above.
In order to focus more upon what could be said about the state of the ecosystems on Mt. Tam, large data gaps were omitted. However, if a metric had already been described and assessed in one of the chapters in this report, it was included in the roll-up regardless of whether or not there was currently enough data to assign a condition or trend score. Consequently, some taxonomic communities, such as invertebrates, are currently underrepresented, even though they are incredibly important to the mountain’s overall health. Omissions are due only to a lack of analyzable data, and as data gaps are filled, these ecosystem roll-ups will be further refined.